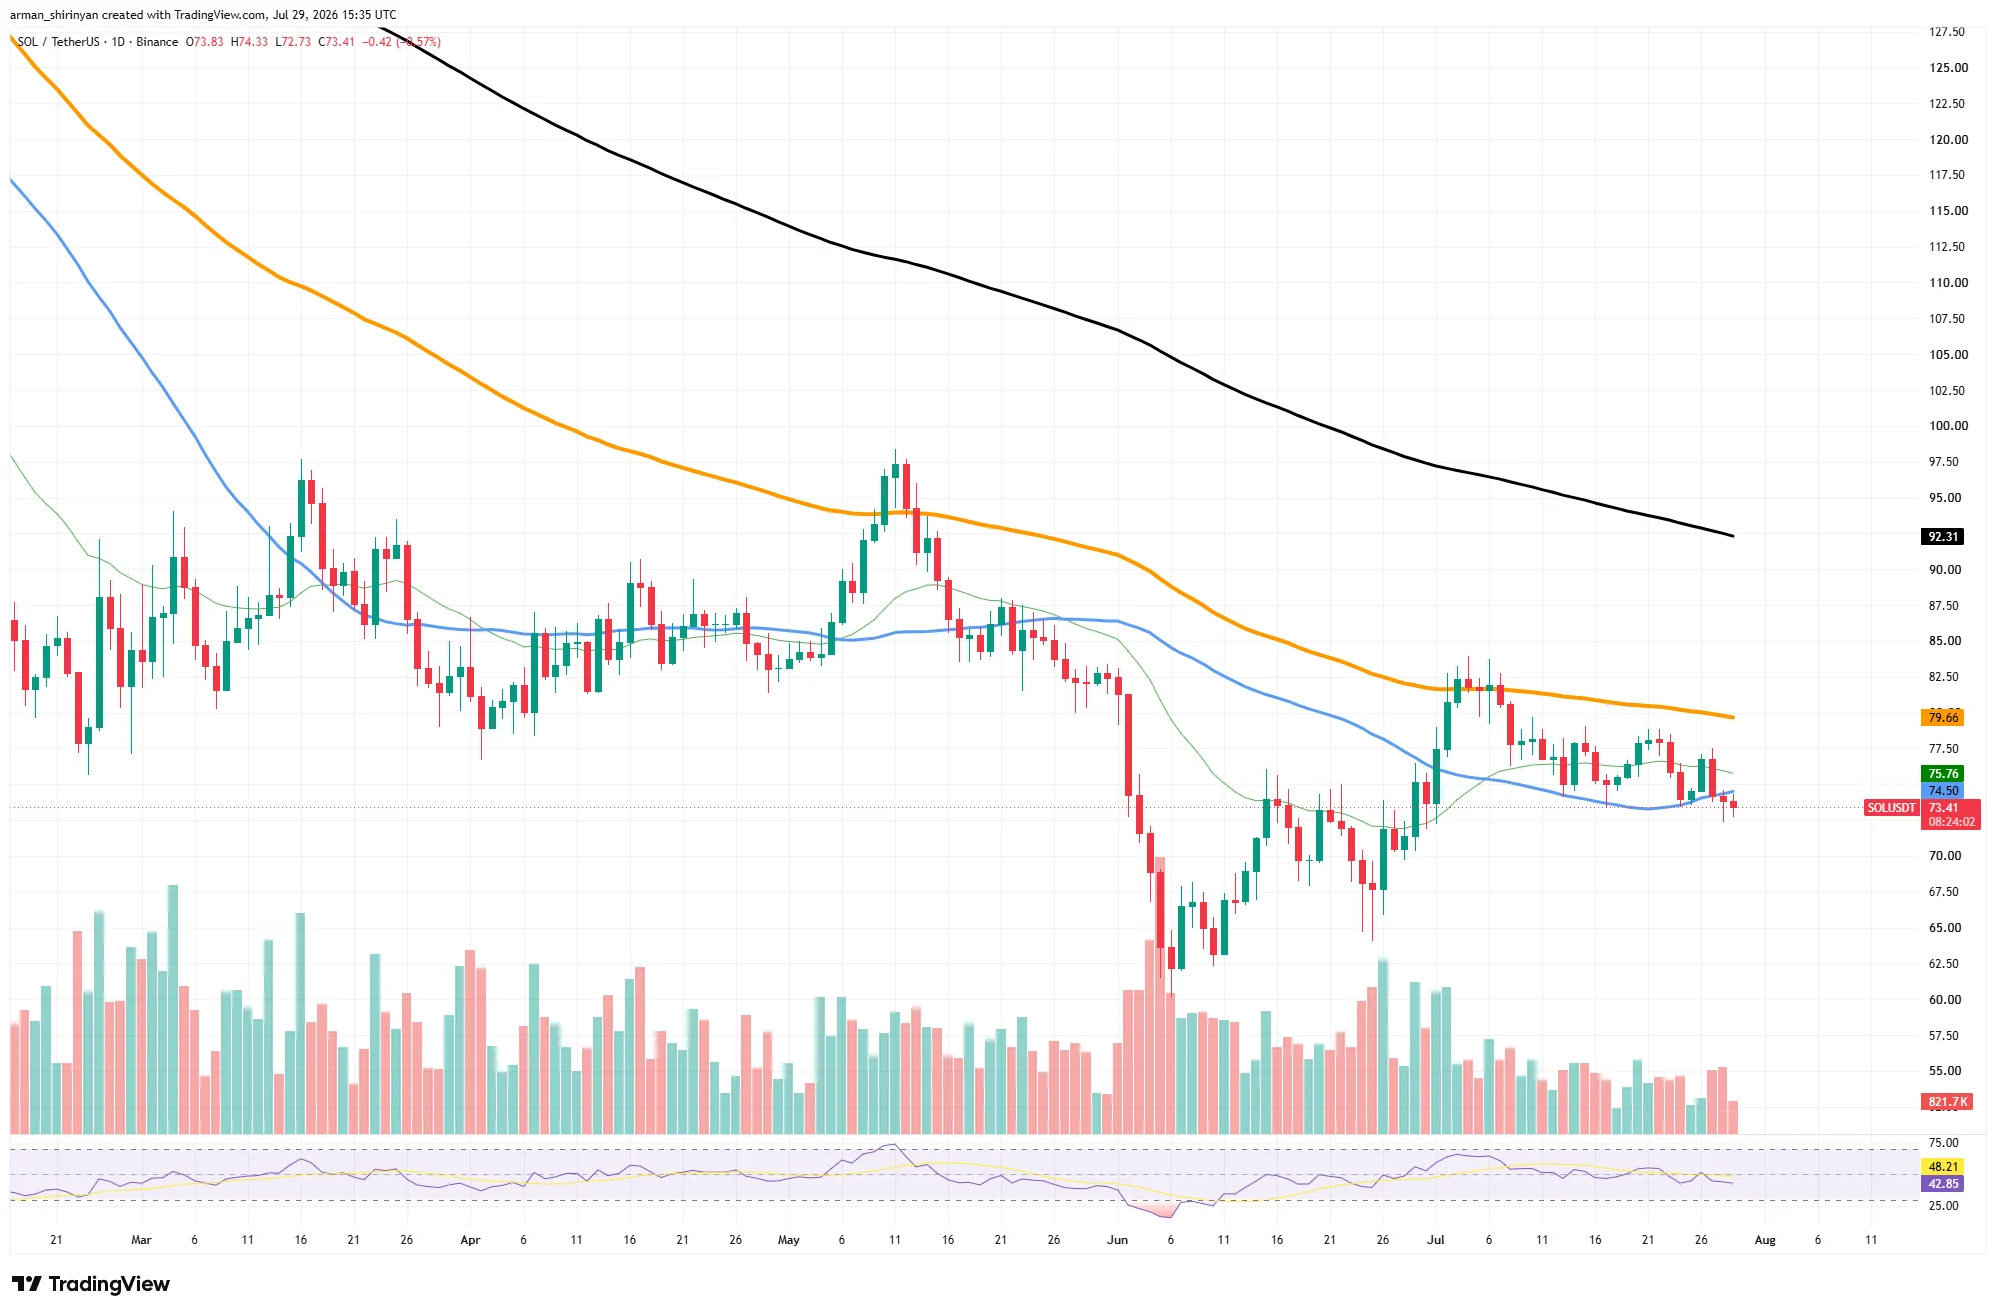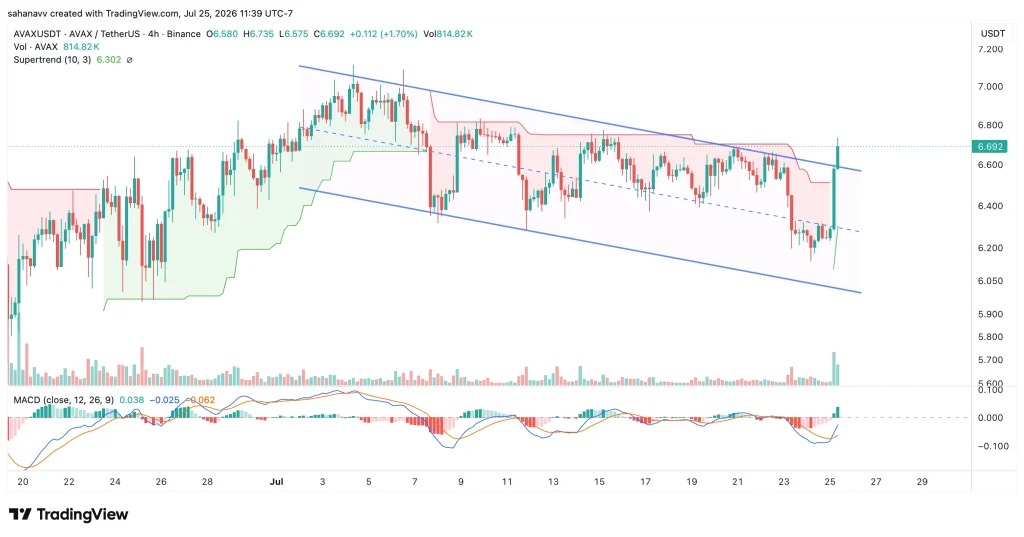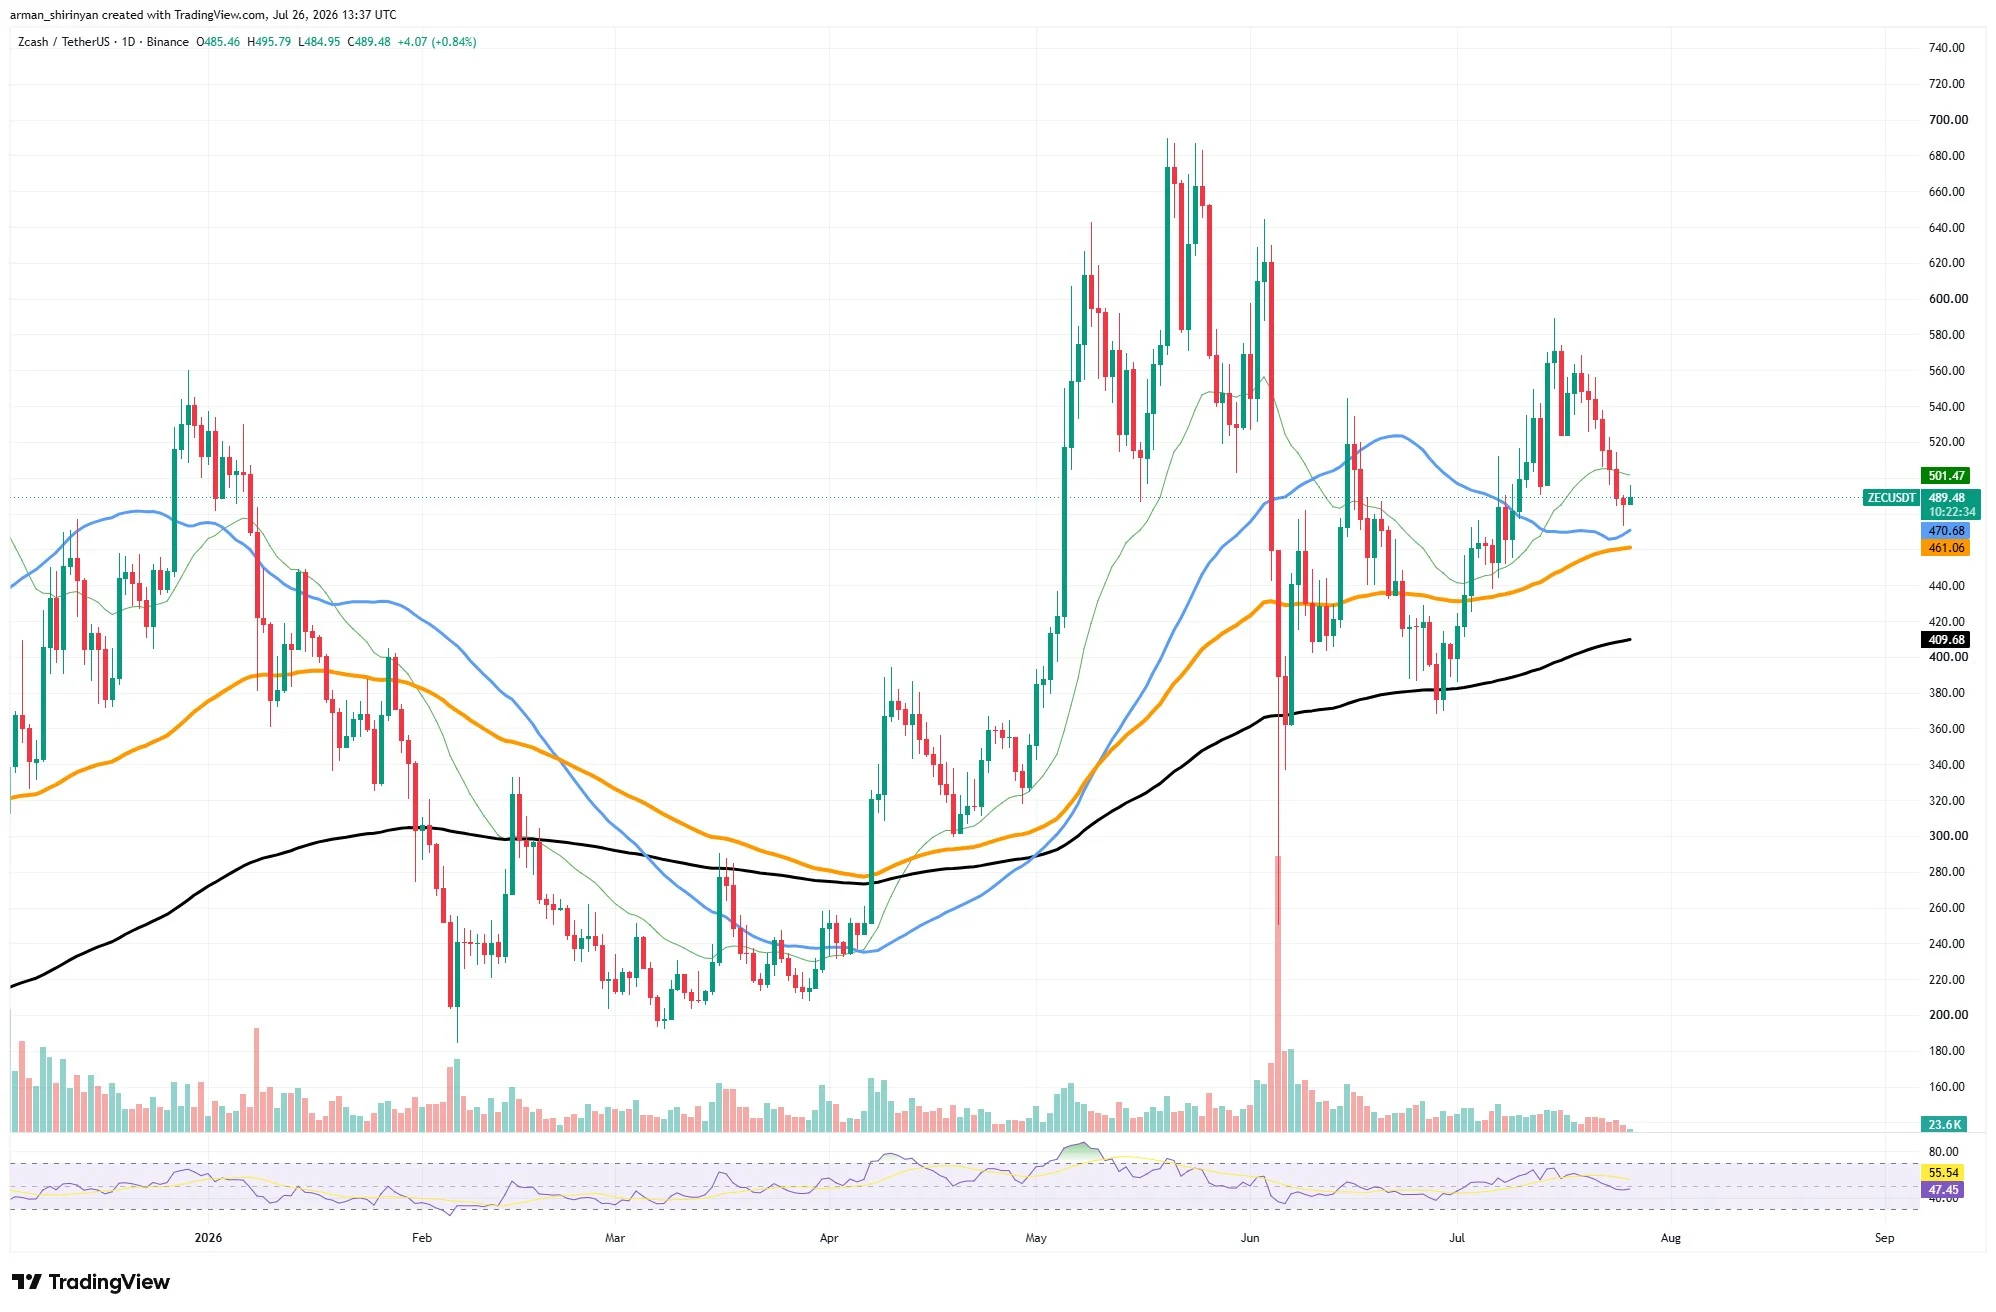


Foreign media analysis suggests that after a period of decline, XRP, Cardano, Stellar, and Bitcoin have all shown signs of recovery recently. A common characteristic of these assets is that prices have rebounded above some short- and medium-term moving averages, and lows are gradually rising, but trading volume has not yet increased significantly, and the market is still awaiting a clearer breakout signal.
XRP is watching the $1.17 resistance level.
XRP is currently fluctuating around $1.13. The article argues that its daily chart has formed a clear ascending triangle pattern, with the lows consistently rising since July, indicating that buyers are gradually entering the market during pullbacks.
The main resistance level is currently near the 50-day moving average, around $1.17. If the price breaks above this level, market attention may turn to the 100-day moving average around $1.24, followed by the psychological level of $1.30.
However, XRP has not yet recovered its longer-term moving averages. The article mentions that the 200-day moving average is around $1.44, indicating that its medium-term trend has not yet fully reversed. A break below the $1.05 to $1.00 support zone could destroy the current recovery structure.
ADA and XLM test higher range
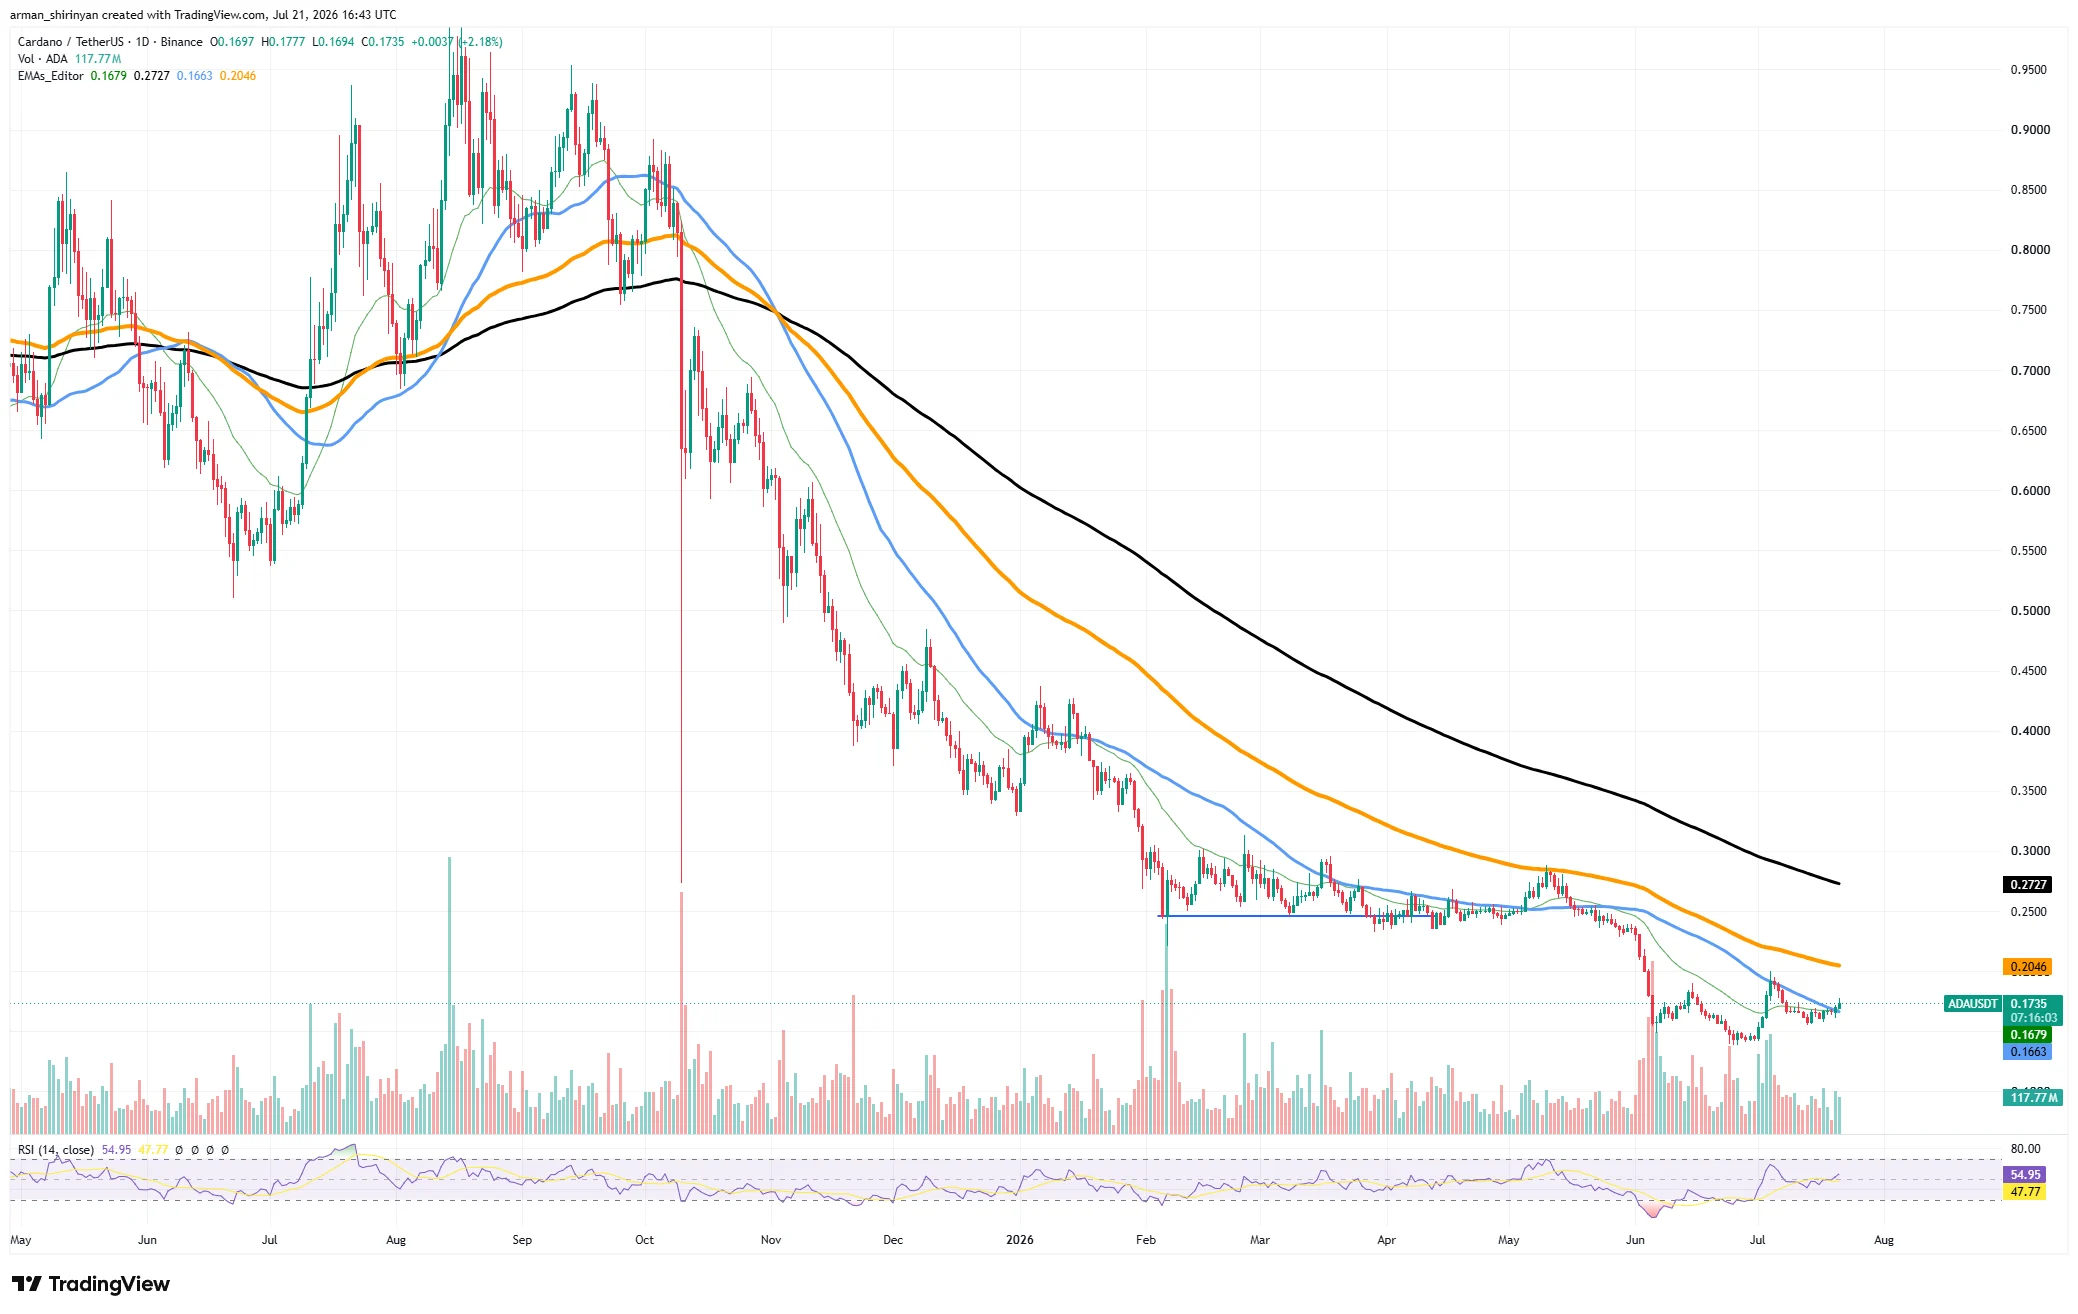
Regarding Cardano, the article states that ADA is currently trading at approximately $0.175, gradually shaking off the weakness following its prolonged sideways movement in the spring. Previously, the price had remained in the $0.15 to $0.16 range; the recent breakout has improved the short-term structure.
According to the analysis in the article, $0.20 is the next major resistance level for ADA, as it is close to the 100-day moving average and also has strong psychological significance. If it continues to rise, it may test the $0.22 to $0.25 area; on the downside, it needs to hold the $0.16 support level.
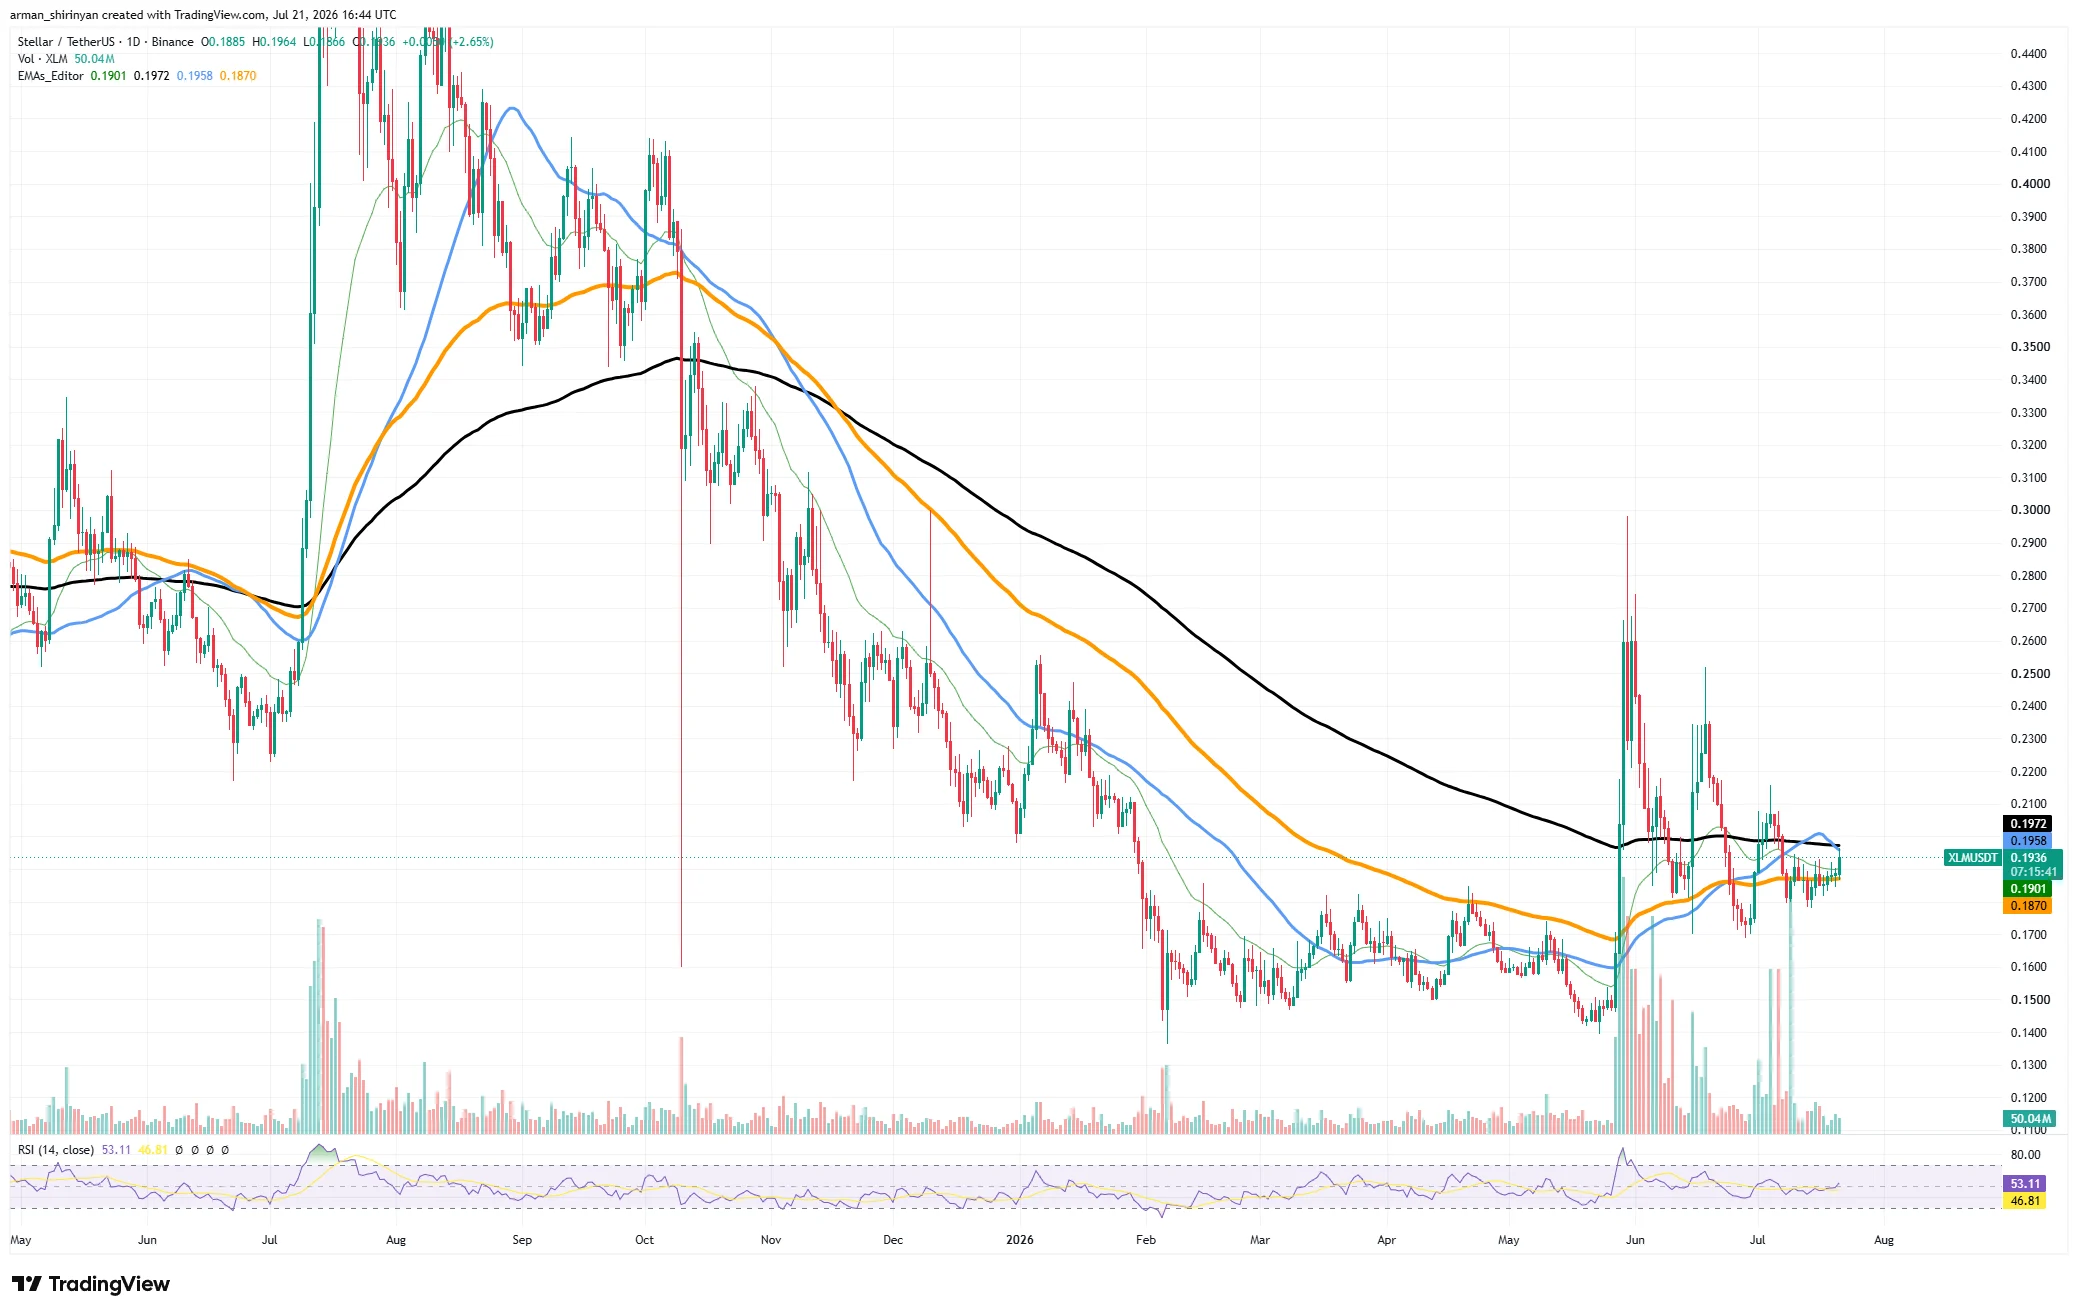
Stellar's performance is also seen as a relatively clear example of a recovery. XLM is currently around $0.19, with its 20-day, 50-day, and 100-day moving averages converging. The article argues that this compression pattern often indicates a potential increase in volatility.
If the price breaks through the $0.20 to $0.21 resistance zone, the next targets may be $0.23 and $0.25; if it falls below $0.18, market attention may return to $0.16.
Bitcoin focuses on $68,000
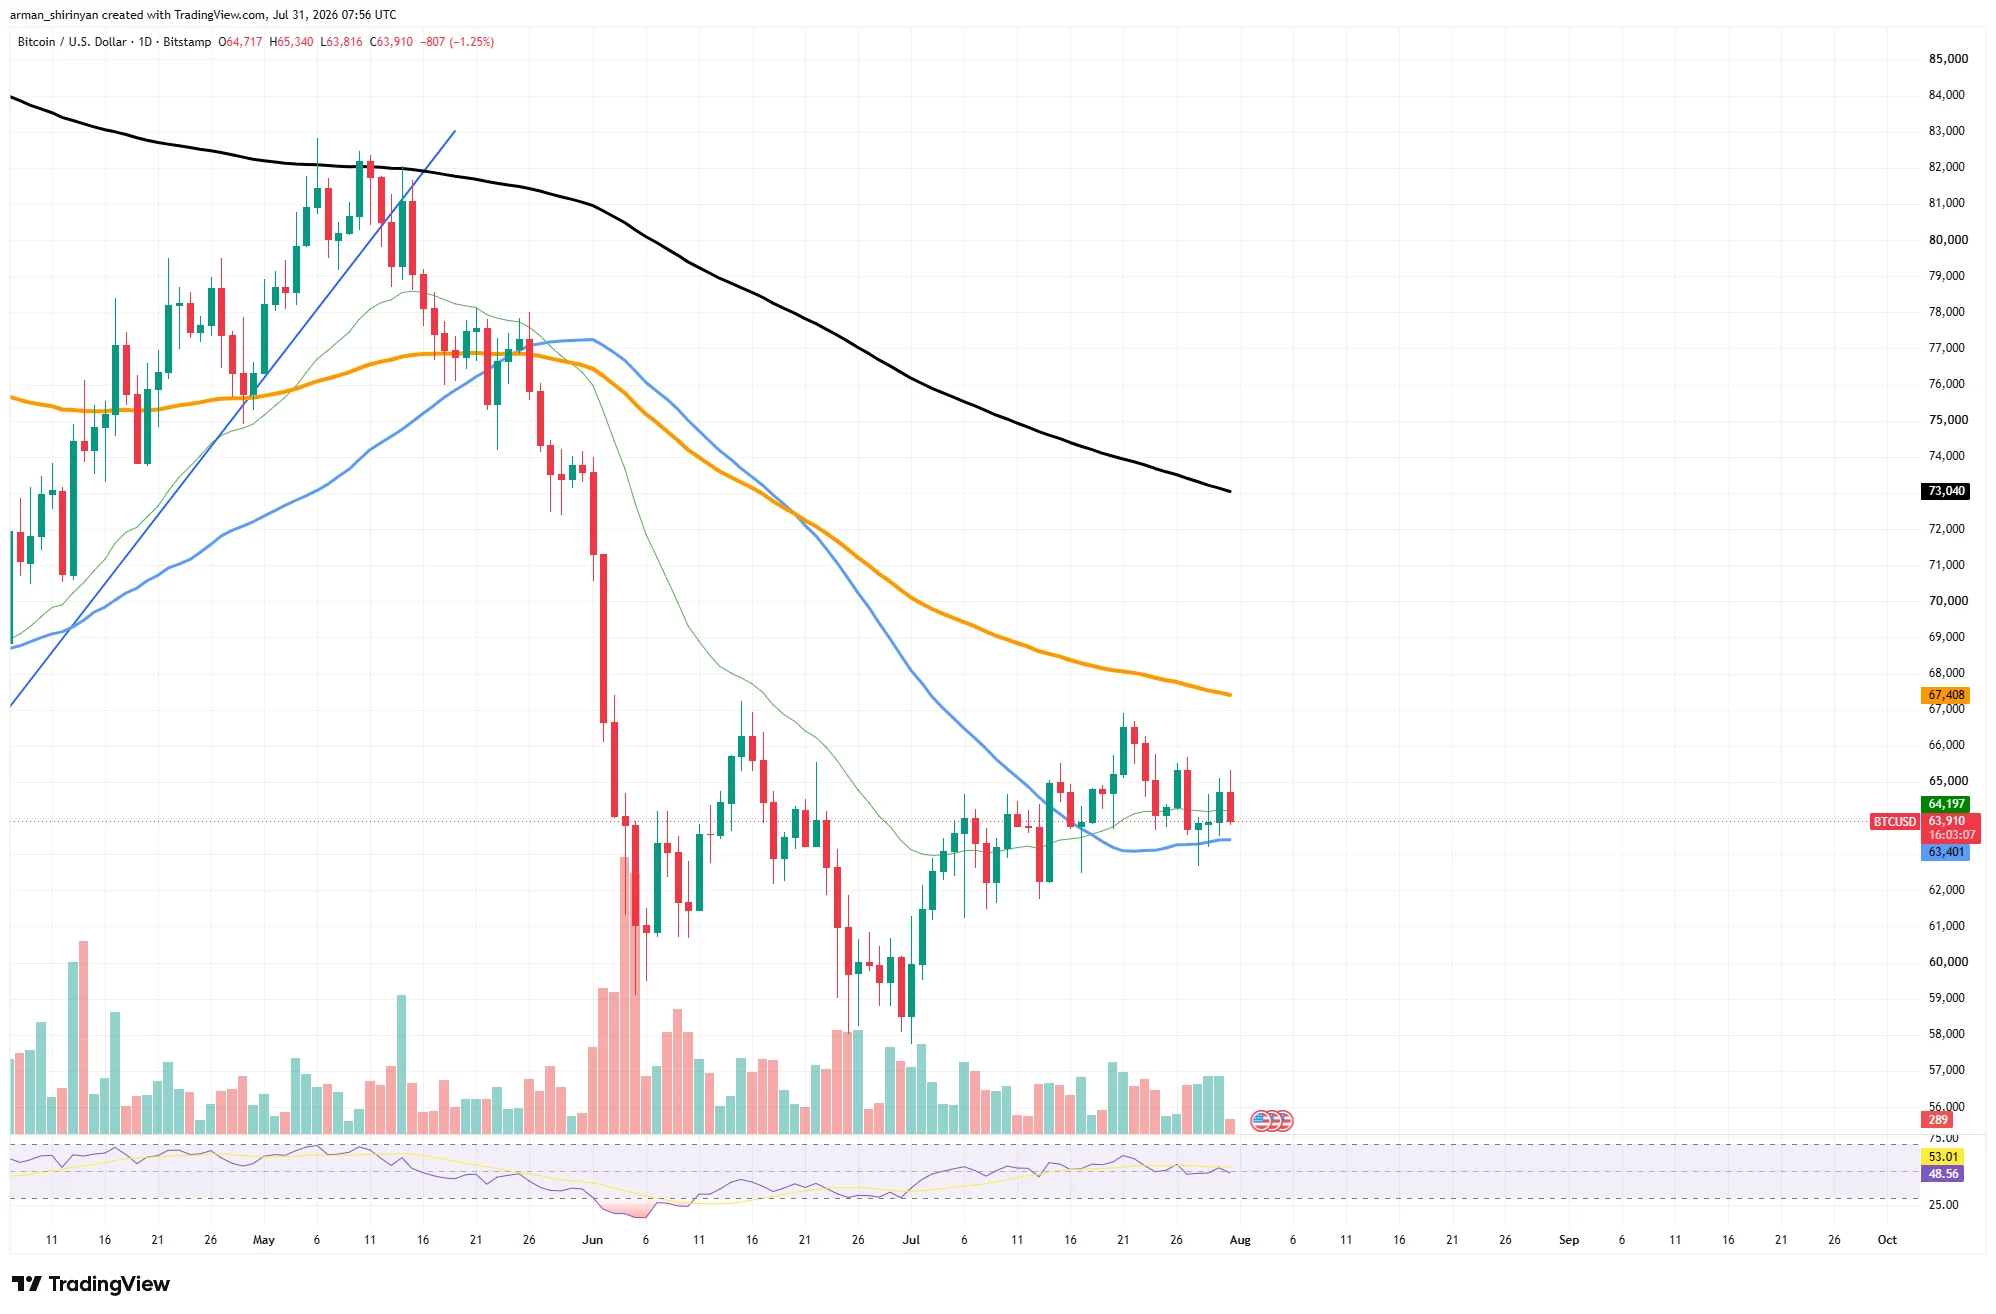
Bitcoin is currently trading at around $66,300. The article states that after a sharp drop in June, BTC has recently formed a series of higher lows, indicating that buying interest is gradually returning and the short-to-medium-term structure has improved compared to before.
The most closely watched level right now is around $68,000. The article points out that this is close to the 100-day moving average and has been a resistance zone for previous rebounds. If the price breaks through this level, the market could potentially target the $72,000 to $75,000 range.
Looking at the downside, the $63,000 to $64,000 range remains a key short-term support zone. The article argues that as long as Bitcoin stays above this range, the current corrective trend is likely to continue. Overall, this analysis summarizes the recent changes in several major crypto assets as improvements in technical patterns, but whether this can evolve into a more sustained upward trend depends on whether key resistance levels can be broken.