

Curve DAO token CRV surged over 10% on Tuesday after breaking through a downtrend line that had lasted for about six months. Along with the price increase, derivatives trading volume and open interest rose simultaneously, and on-chain activity also improved, with the market focusing on whether this rally can continue.
Derivatives data also strengthened.
According to Coinglass data, in the past 24 hours, the trading volume of CRV derivatives increased by more than 102%, rising to approximately $86 million; open interest increased by more than 18%, approaching $67 million.
A price increase accompanied by an increase in open interest typically indicates the entry of new funds, rather than just existing short covering. This suggests that market participation in the subsequent movement of CRV is increasing after the trend line was broken.
- Derivatives trading volume was approximately $86 million.
- Open interest is approximately $67 million.
- The price increased by more than 10% in 24 hours.
On-chain activity remains resilient
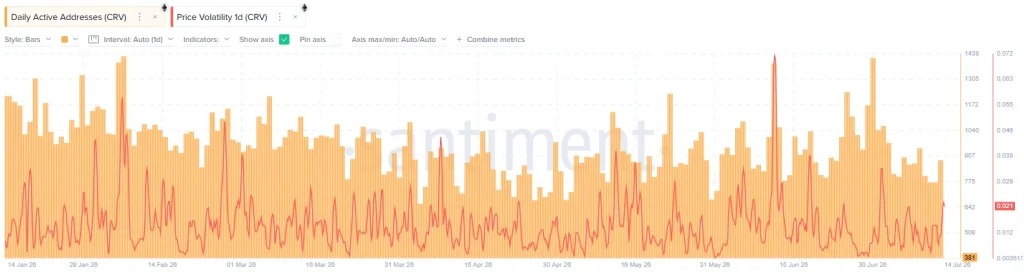
Beyond the derivatives market, on-chain data also shows that user engagement within the Curve ecosystem has not weakened significantly. The article mentions that although CRV has been constrained by key resistance levels for the past few months, daily active addresses have remained relatively stable in recent weeks.
This means that there has been no significant loss of on-chain activity during the price consolidation phase. Although current activity is still below the highs of the previous cycle, this change aligns with the recent improvement in price structure, providing some support for a rebound.
The market is focused on the subsequent resistance range.
From a price structure perspective, CRV has previously found buying support in the $0.20 to $0.21 range multiple times. Now that it has broken through this level, it has become a key support level to hold in the short term. If the price continues to stabilize, the market will first focus on the $0.27 to $0.28 area.
This range coincides with the previous swing high and the 200-day moving average, representing the next major resistance level. A further breakout above this level could shift market focus to the $0.33 to $0.34 area.
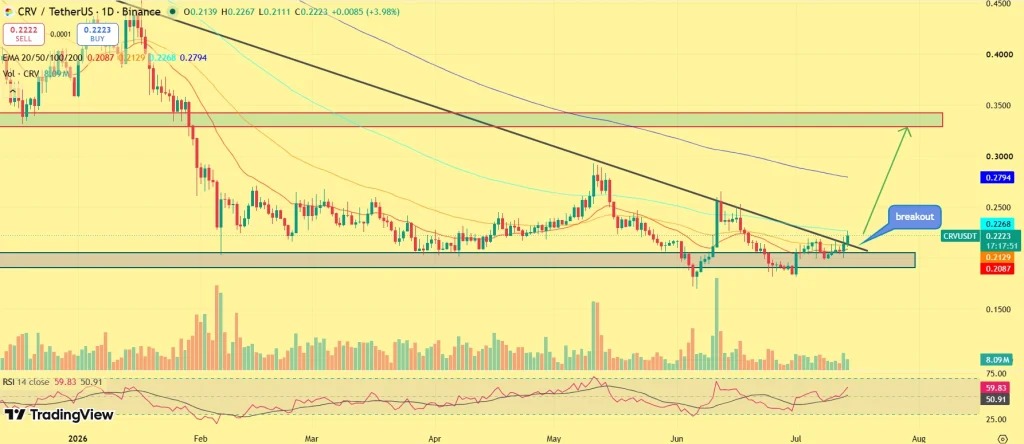
Meanwhile, the Relative Strength Index (RSI) has returned above 50, indicating that momentum has strengthened compared to the previous period, but it has not yet entered a clearly overheated zone. Going forward, whether the RRS can turn its breakout level into support will be a crucial point to observe in determining whether this upward trend will continue.