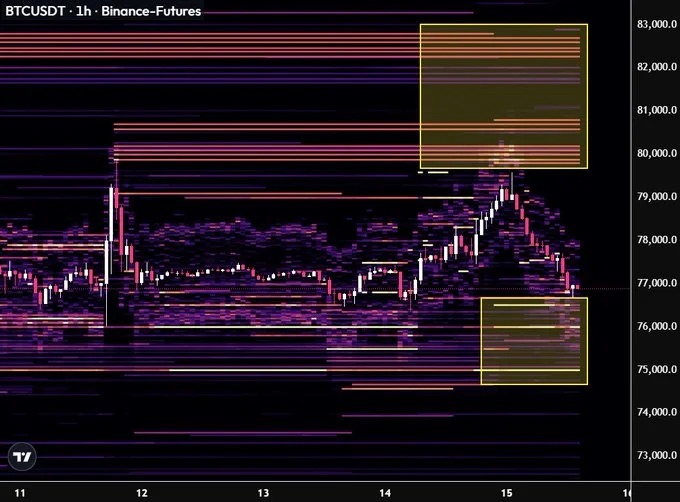





Foreign media reports that since mid-August, after Bitcoin rebounded from around $63,000, it once rose to the range of $80,000 to $81,500. However, in recent trading days, its upward momentum has weakened, and there are signs of a dome pattern on the four-hour chart. The article suggests that the range of $76,000 to $76,300 has become the most critical support level for the short term.
Around $76,000 serves as a key support level.
According to the calculations in the text, the distance between the top of the dome pattern and the neckline is approximately $5,000 to $5,300. If the price confirms a break below around $76,000, the corresponding downward target for this pattern would be roughly between $70,900 and $71,000.
Currently, Bitcoin is still operating above this area, indicating that the pattern has not been fully confirmed. Only when it closes clearly below the support level on a four-hour time frame will the market be more inclined to regard this round of adjustment as the beginning of a further decline.
Short-term indicators show a seesaw battle between bulls and bears
From a technical indicators perspective, the four-hour Relative Strength Index (RSI) is around 54.5, which falls within a neutral range, indicating neither obvious overbought nor oversold conditions. At the same time, prices continue to hover near the 20-day, 50-day, and 100-day moving averages, reflecting that buyers and sellers are still in a state of ongoing contention.
The article argues that if Bitcoin manages to return to the range of $79,500 to $80,000, the downward expectations brought about by the dome pattern will significantly weaken. If it breaks through the previous high of around $81,500, this bearish structure will essentially become invalid, and market attention will once again shift towards upward potential.
Weak spot demand is dragging down the trend.
In addition to chart patterns, the article also mentions the divergence at the level of on-chain and transaction data. The 30-day demand growth data for CryptoQuant shows that in September, the demand for perpetual contracts remained positive, but the spot demand continued to be in the negative range, resulting in the overall demand still being below zero.
This means that recent buying orders have come more from leveraged derivative transactions, rather than investors directly absorbing Bitcoin in the spot market. The article points out that such price increases driven by futures are usually more fragile, and once traders close their positions or face liquidation, price fluctuations can quickly intensify.
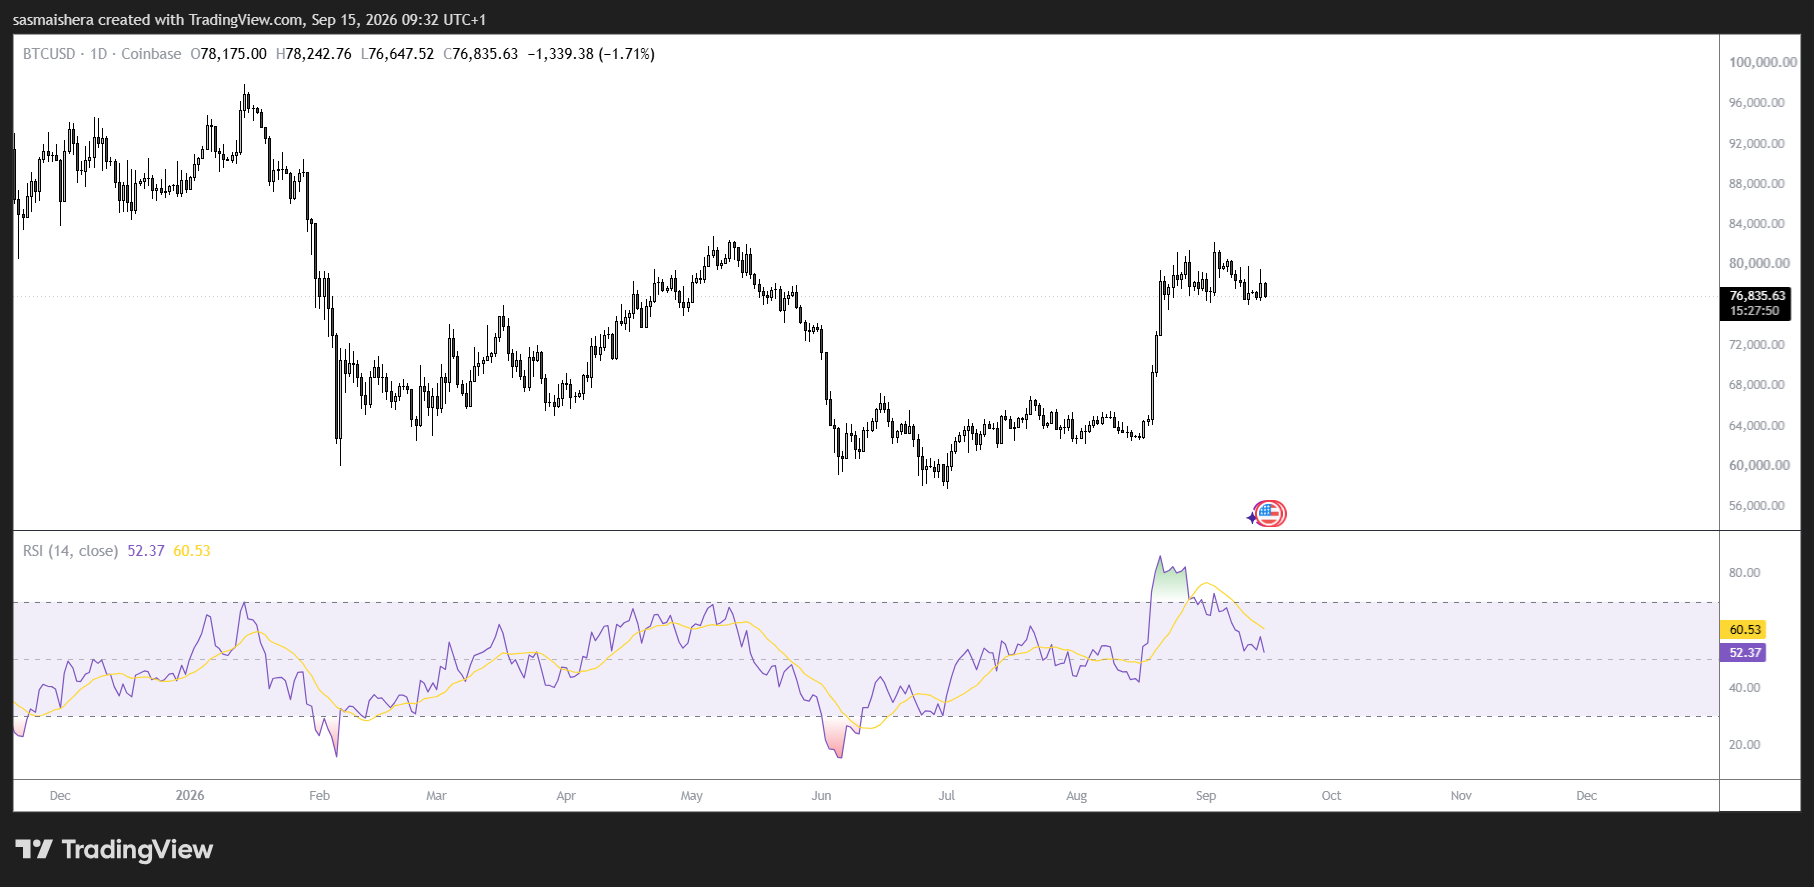
It is also mentioned in the text that a similar divergence occurred from January to February 2026: futures demand briefly rebounded, but subsequently, both overall demand and prices weakened. The article argues that this does not necessarily mean that the current trend will repeat the outcomes of that time, but until spot demand has significantly recovered, the support level of $76,000 remains the price point that the market needs to pay the most attention to.